
More listings, fewer sales, and what it means for you

The following stats are provided by the Toronto Regional Real Estate Board (TRREB). They are specifically for the City of Toronto which includes Etobicoke, Central Toronto, North York, East York and Scarborough.
As we all know, 2023 has been a year marked by significant changes, particularly in response to higher interest rates and economic uncertainty.
In our previous reports, we've discussed how the market has been responding to these challenges, and the latest data continues to tell a story of a market in flux.
One notable trend we've observed recently is the coexistence of a higher level of new listings and relatively slow sales activity.

“Record population growth and a relatively resilient GTA economy have kept the overall demand for housing strong. However, more of that demand has been pointed at the rental market, as high borrowing costs and uncertainty on the direction of interest rates has seen many would-be home buyers remain on the sidelines in the short term. When mortgage rates start trending lower, home sales will pick up quickly,” said TRREB President Paul Baron.

Now, let's talk about new listings. October 2023 saw them popping up more than they did in October 2022. And over the past 10 years, this year is in the top 3 for highest number of new listings in October.
On a month-to-month basis, the influx of new listings exhibited a modest decline. However, viewed against the backdrop of the entire year, they remain elevated.
This abundance of choices can favour buyers, allowing them to be more selective and potentially negotiate better deals. It provides buyers with the luxury of time to carefully evaluate properties and make well-informed decisions.
For sellers, an oversupply of listings can present challenges. With more properties competing for a limited number of buyers, it becomes crucial for sellers to position their homes effectively, possibly through competitive pricing, staging, or unique selling points.
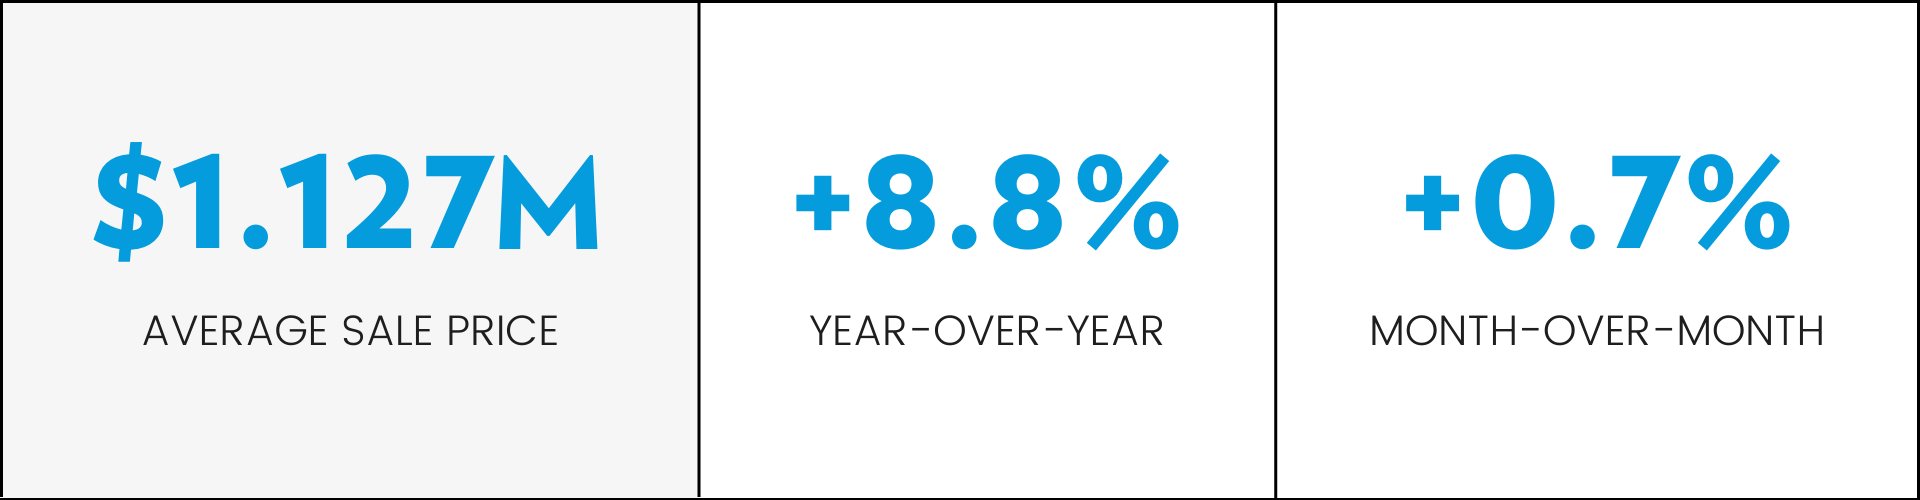
For the second month in a row, the average selling price in Toronto was up both month-over-month and year-over-year.
“Competition between buyers remained strong enough to keep the average selling price above last year’s level in October and above the cyclical lows experienced in the first quarter of this year. The Bank of Canada also noted this resilience in its October statement. However, home prices remain well-below their record peak reached at the beginning of 2022, so lower home prices have mitigated the impact of higher borrowing costs to a certain degree,” said TRREB Chief Market Analyst Jason Mercer.
Understanding key real estate market metrics: sales to new listing ratio, days on market, and months of inventory
The sales to new listing ratio tells us how many of the newly listed properties are being sold in a certain time frame. If the ratio is around 50%, it means the market is balanced. But if it goes above 60%, that's when we start to see a seller's market, where prices tend to rise. So, the higher the ratio, the better it is for sellers and the more competitive the market becomes for buyers.
The average days on market refers to the average amount of time that it takes for a property to be sold after it is listed for sale. This can be a useful metric for understanding how quickly homes are being snapped up in a particular area.
Lastly, the months of inventory ratio is a measure of the amount of time it would take for all of the currently listed properties to be sold, based on the current rate of sales. It's a useful metric for understanding how much supply there is relative to demand in a particular area. For example, if there are 100 properties currently listed for sale and 20 of them are sold each month, it would take 5 months to sell all of the properties (100 / 20 = 5).
October 2023:
October 2022:

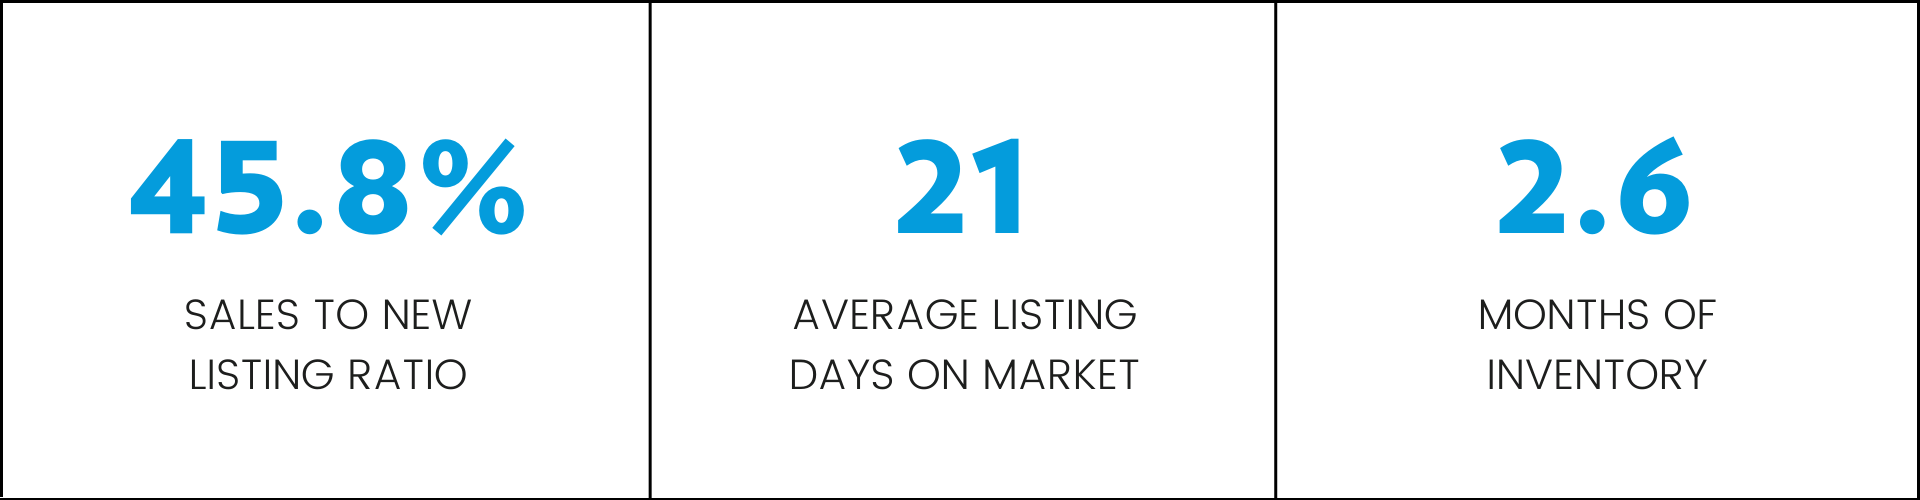
Last month, our sales-to-new-listing ratio was at 47.3%, showing a balanced market. In October, it dropped to 45.8%. This move suggests we're steadily heading toward a buyer's market, where buyers have more sway and options – typically seen when the ratio goes below 40%.
It's important to note that our current average of 21 days on the market is a healthy departure from the lightning-fast sales experienced during Toronto's peak seller's market just last spring. Back then, properties often sold within days, even hours. Today's market offers a more balanced pace, providing both buyers and sellers with a bit more time for thoughtful decision-making without the intense urgency of the past.
This month's uptick in new listings compared to sales has caused our months of inventory to inch up by a point since last month. This translates to more properties available now than just a month ago and significantly more than this time last year.
For buyers, the current market's slower pace means you have the advantage of time and increased negotiation power. There's a wide selection of properties to explore, but remember, the ones that check all the boxes tend to sell the quickest.
Now, sellers, with the market evolving, it's time to get strategic. Price your property right and give it some extra love in it's presentation to stand out. Collaborate with a local realtor who has a wide range of services and marketing capabilities. This partnership can ensure your listing gets the best possible exposure, increasing its chances of standing out in the current market.
For more insights on this, be sure to check out our most recent Sold Story.
If you have any questions or would like more information on how this is affecting recent home sales in your specific neighbourhood, please don't hesitate to get in touch!