
Surprising Bids Signal Market Awakening Amid Steady Interest Rates


In this report, we'll be breaking down the January stats provided by the Toronto Regional Real Estate Board (TRREB). They are specifically for the City of Toronto which includes Etobicoke, Central Toronto, North York, East York and Scarborough.
As we emerged from the holiday season and welcomed the new year, it was hardly surprising to witness a subdued start to January in the real estate market - a typical occurrence during this time.
Yet, the anticipation was palpable, especially following the Bank of Canada's decision to hold its policy interest rate steady for the third consecutive month in December.
Amidst this backdrop, we were acutely aware of the pent-up demand from buyers and the cautious stance of sellers, all keenly observing the market's pulse.
This collective anticipation set the stage for what we hoped to be a January marked by awakening signs of activity, spurred on by expectations of interest rate shifts.
Indeed, January's slow commencement in real estate activities did little to dampen our optimism. Such seasonal lulls are expected, yet beneath this calm surface, the market was anything but stagnant.
As the month advanced, especially nearing its close, coinciding with the fourth consecutive holding of interest rates, a noticeable change began to stir.
A home in Danforth Village attracted 20 offers on January 29th, selling for an astonishing $321,000 over its asking price.
Just two days later, another property located at the intersection of Woodbine and Danforth received 15 offers, closing at $451,000 above asking.
These instances aren't mere outliers; they signify a rapid shift in the market dynamics.
This surge in activity and the dramatic over-asking sales prices are critical indicators of the market's pent-up demand finally being released.
For sellers, especially, this trend underscores a golden opportunity.
Firstly, it demonstrates that despite the slow start to the year, there's a significant pool of buyers actively seeking homes and willing to engage in competitive bidding to secure their desired property.
This not only positions sellers in a favourable spot to command higher selling prices but also indicates a shift towards a seller's market, at least in these hotspots.
Recently, you might have seen a headline about a house in Mississauga that received an astonishing 85 offers at the end of January. This shows us that there are potentially 84 eager individuals still searching for homes in that area.
At the beginning of February we assisted a client in selling their Newmarket home. After over 50 showings and listing it with a scheduled offer date, we received a preemptive 'bully' offer $181,000 over the asking price.
It's crucial to underline that this burgeoning activity, becoming evident towards January's end, has not been fully captured in the statistics we're about to delve into.
However, these early indicators of movement are just the tip of the iceberg, hinting at the potential for a significant momentum shift as 2024 progresses.
Now, let's dive into the details and explore what happened in January.

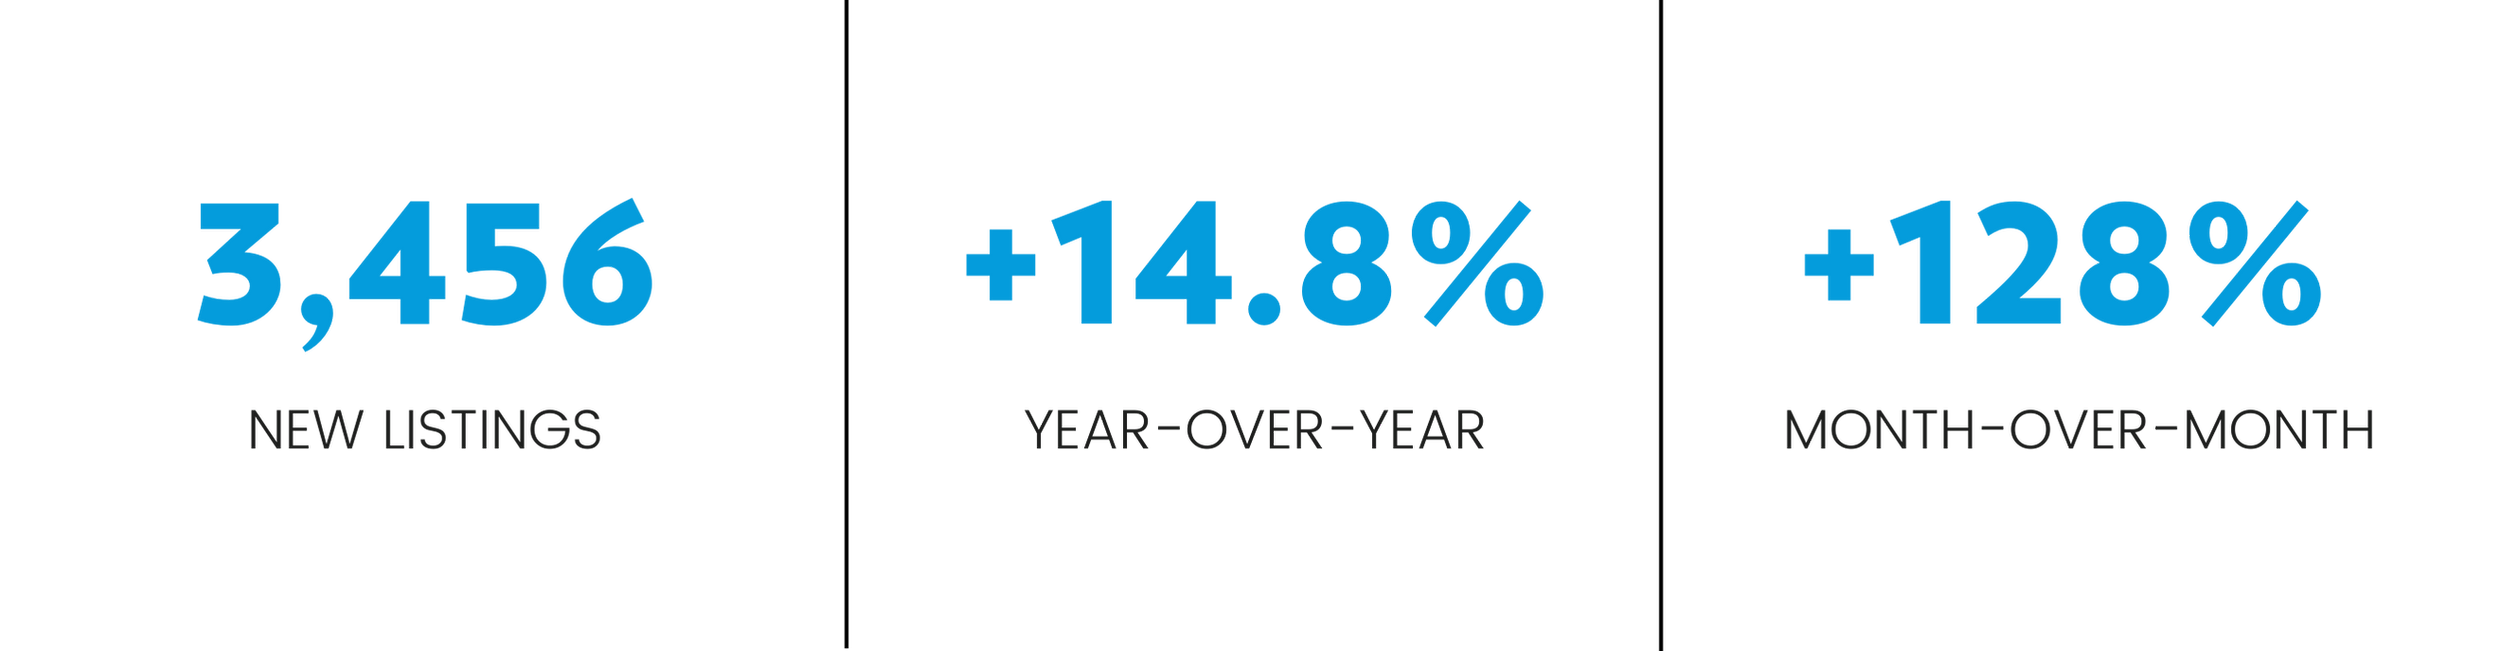
Sales were off to a slow start in January, but we saw a decent increase compared to last month and January of last year. This increase came as some homebuyers started to benefit from lower borrowing costs associated with fixed rate mortgage products.
New listings were also up year-over-year, but by a lesser annual rate compared to sales. The resulting tighter market conditions when compared to the same period a year earlier, potentially points toward renewed price growth as we move into the spring market.
The month-over-month increase in listings compared to sales could be influenced by seasonal factors, as December historically records low sales. However, the year-over-year growth in sales outpacing listings suggests that this is a temporary condition and that demand remains strong over time.
The combination of short-term and long-term trends could indicate a market in transition. Initially, buyers might enjoy more negotiating power due to increased short-term inventory. However, the strong annual sales growth implies that this buyer's advantage might be short-lived as the market absorbs the inventory, potentially transitioning back to a seller's market.
“Once the Bank of Canada actually starts cutting its policy rate, likely in the second half of 2024, expect home sales to pick up even further. There will be more competition between buyers in 2024 as demand picks up and the supply of listings remains constrained. The end result will be upward pressure on selling prices over the next two years,” said TRREB Chief Market Analyst Jason Mercer.

Reflecting on the average price trends, we observed a slight dip from last month alongside gentle fluctuations over the past year.
This pattern highlights the market's resilience and adaptability, effectively weathering the storm of wider economic factors such as shifting interest rates and the ever-changing supply-demand dynamics.
Understanding key real estate market metrics: sales to new listing ratio, days on market, and months of inventory:
The sales to new listing ratio tells us how many of the newly listed properties are being sold in a certain time frame. If the ratio is around 50%, it means the market is balanced. But if it goes above 60%, that's when we start to see a seller's market, where prices tend to rise. So, the higher the ratio, the better it is for sellers and the more competitive the market becomes for buyers.
The average days on market refers to the average amount of time that it takes for a property to be sold after it is listed for sale. This can be a useful metric for understanding how quickly homes are being snapped up in a particular area.
Lastly, the months of inventory ratio is a measure of the amount of time it would take for all of the currently listed properties to be sold, based on the current rate of sales. It's a useful metric for understanding how much supply there is relative to demand in a particular area. For example, if there are 100 properties currently listed for sale and 20 of them are sold each month, it would take 5 months to sell all of the properties (100 / 20 = 5).
January 2024:

January 2023:
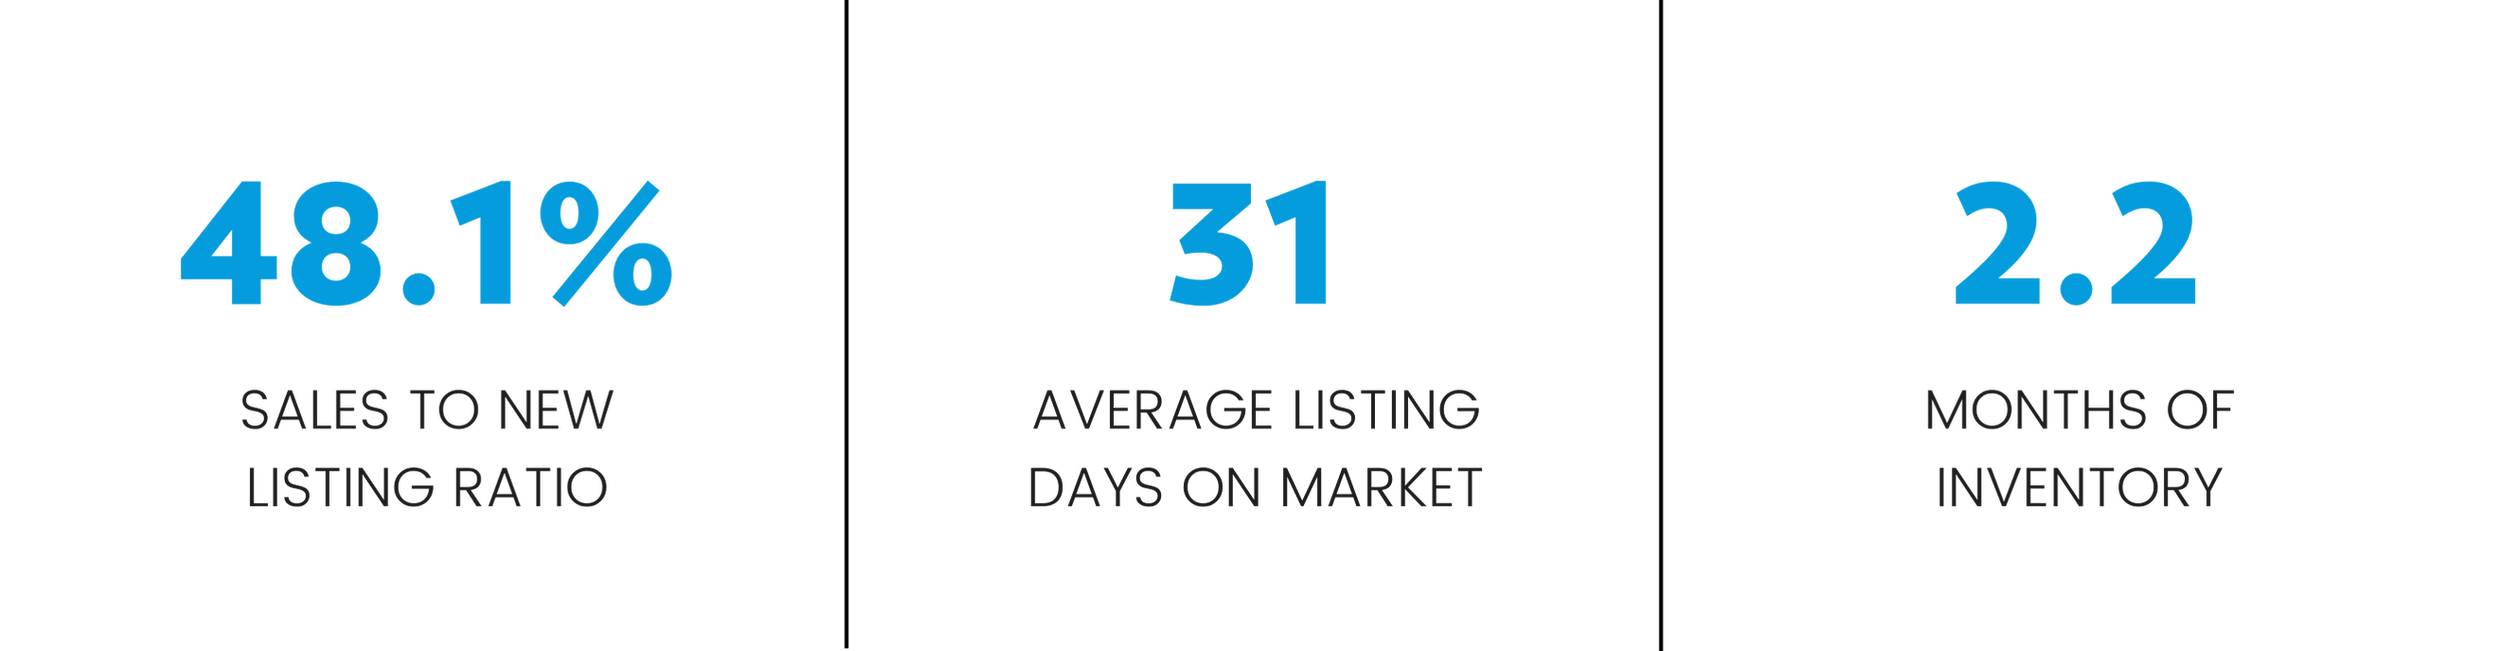
Examining the Sales-to-New Listings Ratio (SNLR) at 45.2% clearly signals a buyer's market, underscored by the average time homes spend on the market. Furthermore, an increase in the months of inventory highlights a scenario where available homes outnumber active buyers.
As we wrap up our insights on January, the picture painted is one of a cooling market. However, the surge in activity as we step into February paints a different picture - one of a dynamic and potentially rebounding real estate environment.
This shift serves as a powerful reminder for anyone thinking of buying or selling to stay nimble, responsive to the market's evolving conditions, and optimistic about the opportunities that rapid changes can present.
While the past month may have shown signs of a market that’s still cooling, the early days of February signal a market that's very much alive and kicking.
If you have any questions or would like more information on recent home sales in your specific neighbourhood, don't hesitate to connect with us here.