
Sales Surge, Prices Rise, and Listings Struggle to Keep Pace
The following statistics are provided by the Toronto Regional Real Estate Board (TRREB). They are specifically for the City of Toronto which includes Etobicoke, Central Toronto, North York, East York and Scarborough.
The City of Toronto is experiencing a remarkable surge in sales with an astounding 22.6% percent increase compared to last year, and 20.1% compared to last month.
“The demand for ownership housing has picked up markedly in recent months. Many homebuyers have recalibrated their housing needs in the face of higher borrowing costs and are moving back into the market. In addition, strong rent growth and record population growth on the back of immigration has also supported increased home sales,” said TRREB Chief Market Analyst Jason Mercer.

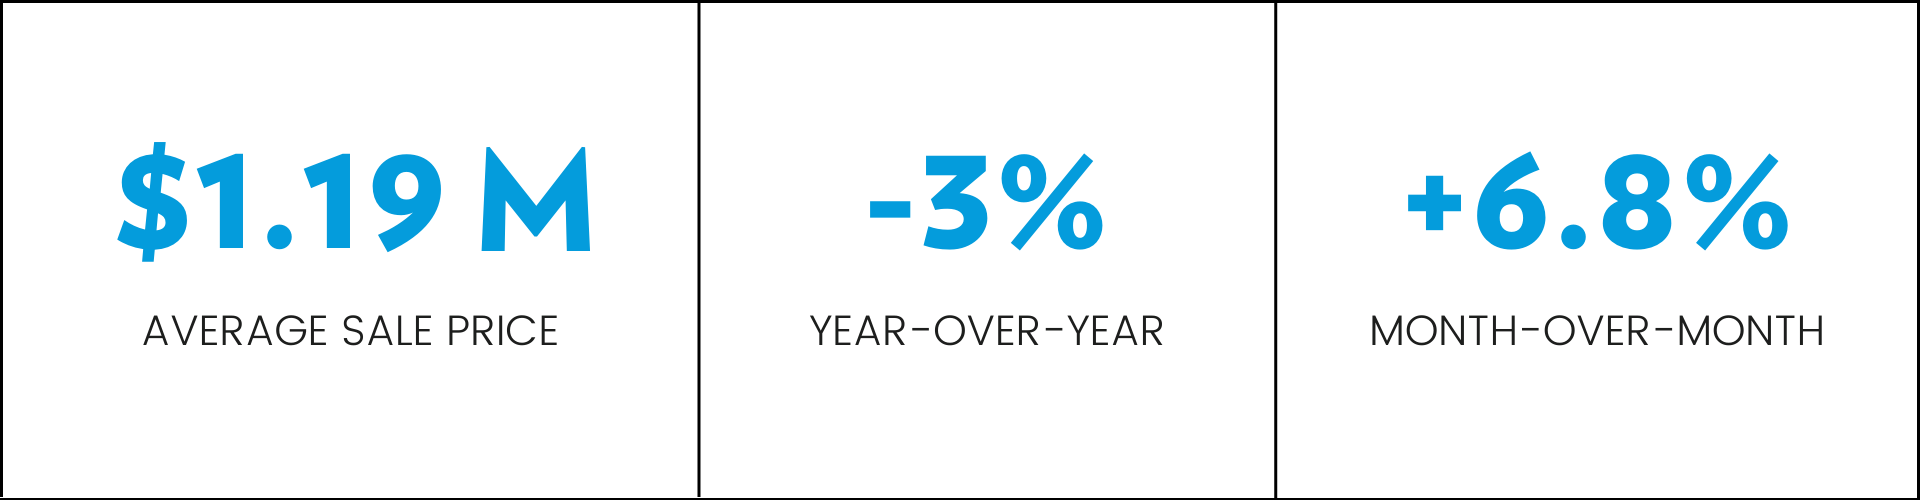
The average selling price in May reached an impressive $1,197,021. While there was a slight 3% dip compared to last year's record high of $1,233,748, it's important to note that prices have been steadily rising on a monthly basis since the beginning of the year. In fact, prices experienced a 6.8% increase compared to April 2023.
New listings recorded a 16.6% decline compared to the same period last year, revealing a persistent challenge that affects both aspiring homeowners and investors. When demand outpaces supply, it exerts upward pressure on prices, potentially making homeownership less accessible for a wider segment of the population.

Although new listings remain lower compared to the previous year, there has been a consistent month-over-month increase since the record low of 3,110 sales in January, reaching 6,877 in May. This trend indicates a notable resurgence in seller confidence and increased market activity as normally seen in spring.
Understanding key real estate market metrics: sales to new listing ratio, days on market, and months of inventory
The sales to new listing ratio tells us how many of the newly listed properties are being sold in a certain time frame. If the ratio is around 50%, it means the market is balanced. But if it goes above 60%, that's when we start to see a seller's market, where prices tend to rise. So, the higher the ratio, the better it is for sellers and the more competitive the market becomes for buyers.
The average days on market refers to the average amount of time that it takes for a property to be sold after it is listed for sale. This can be a useful metric for understanding how quickly homes are being snapped up in a particular area.
Lastly, the months of inventory ratio is a measure of the amount of time it would take for all of the currently listed properties to be sold, based on the current rate of sales. It's a useful metric for understanding how much supply there is relative to demand in a particular area. For example, if there are 100 properties currently listed for sale and 20 of them are sold each month, it would take 5 months to sell all of the properties (100 / 20 = 5).
May 2023:

May 2022:

In the previous market update, I highlighted that an increase in the sales to new listing ratio and a decrease in average listing days often signify a shift towards tighter or more competitive market conditions. Over the past few months, this shift has indeed occurred.
The average list days have noticeably decreased, indicating properties are selling much faster. Additionally, the sales to new listing ratio has gradually increased and has now reached the 50% mark. If this upward trend continues, we will return to a strong seller's market. And considering all the above, it appears that we are already experiencing the effects of such a market.
If you have any questions or would like more information on recent home sales in your specific neighbourhood, don't hesitate to reach out here.