
Fall Toronto Real Estate Market Update

Today, we’ll be breaking down the September stats provided by the Toronto Regional Real Estate Board (TRREB). They are specifically for the City of Toronto which includes Etobicoke, Central Toronto, North York, East York and Scarborough.
What happened in September?
Expensive borrowing, rising inflation, uncertainty surrounding future Bank of Canada decisions, and slower economic growth continues to have an impact on home sales in Toronto.
Despite these challenges, the average selling price increased both year-over-year and month-over-month. There appears to be an interplay between supply, demand, and seller behaviour in a market that is shifting from a seller's market to a more balanced one.

Even in a balanced or buyer's market, supply and demand dynamics can vary within different segments of the market. Some segments may remain more competitive, leading to higher prices. For example, certain neighbourhoods, property types, or price ranges might experience stronger demand relative to supply, which can drive up prices in those specific segments.
When a market shifts from one extreme, such as a seller's market with high demand to a more balanced market like we have now, there is often a lag in how prices and behaviours respond. Sellers may initially resist reducing their asking prices, hoping to maintain the high values that were typical in the previous market.
This adjustment can translate into properties being sold at or close to the sellers' desired prices. However, the trade-off is that these sales are fewer and tend to require more time to materialize, with buyers mostly drawn towards properties that check all of their boxes.
While prices might not rise as rapidly as in a seller's market, they remain stable or experience slower growth. This transition allows for more thoughtful decisions and fair value transactions.

Although the number of sales remained identical to the previous September, there was a noticeable 7.7% decline in month-over-month sales. This decrease in sales was particularly pronounced for ground-oriented properties, especially semi-detached houses and townhouses.
During periods of economic uncertainty or when buyers prioritize budget-conscious options, condos often emerge as a more accessible path to homeownership. This serves as a key factor that enhances the resilience of the condo market in the midst of shifting market conditions.
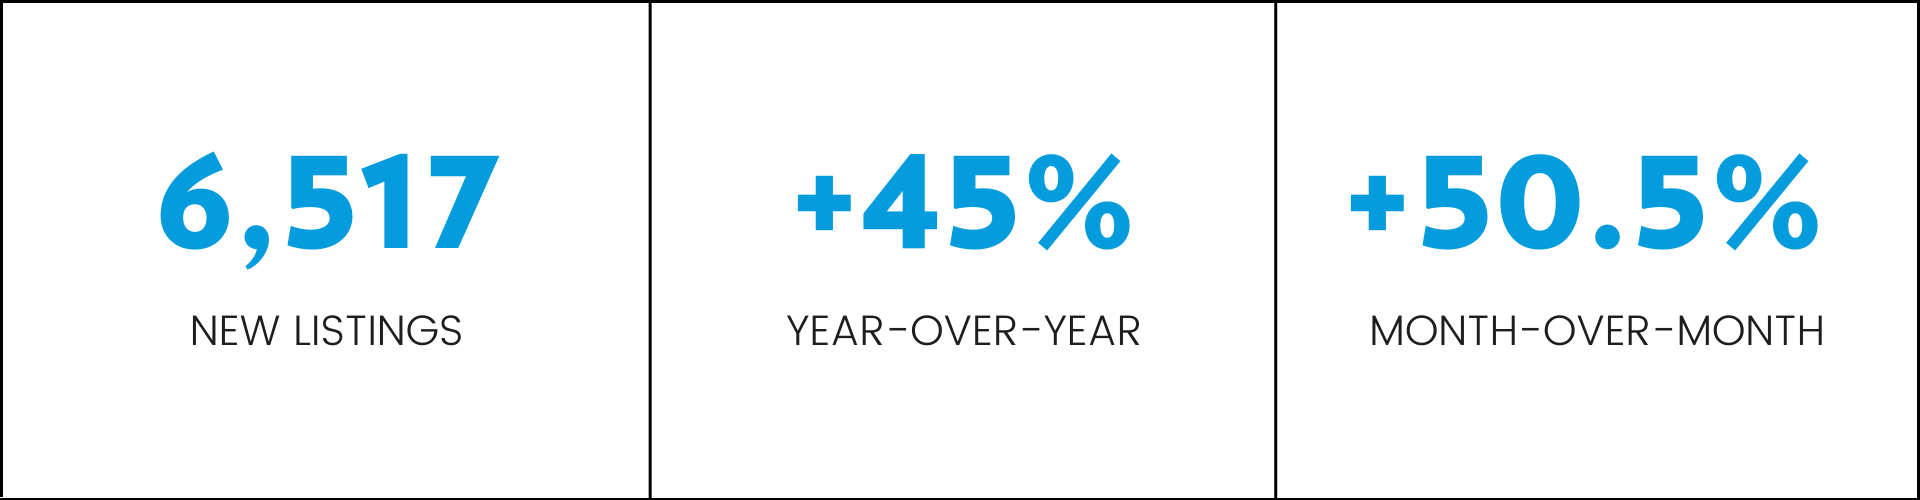
An increase in available listings indicates that the market is in a more balanced state, with a greater supply of homes compared to the demand. While this might benefit buyers in the short term by providing more options and negotiating power, it can lead to slower sales as properties take longer to sell. This situation can put downward pressure on prices, and buyers may wait for more favourable conditions.
“GTA home selling prices remain above the trough experienced early in the first quarter of 2023. However, we did experience a more balanced market in the summer and early fall, with listings increasing noticeably relative to sales. This suggests that some buyers may benefit from more negotiating power, at least in the short term. This could help offset the impact of high borrowing costs,” said TRREB Chief Market Analyst Jason Mercer.
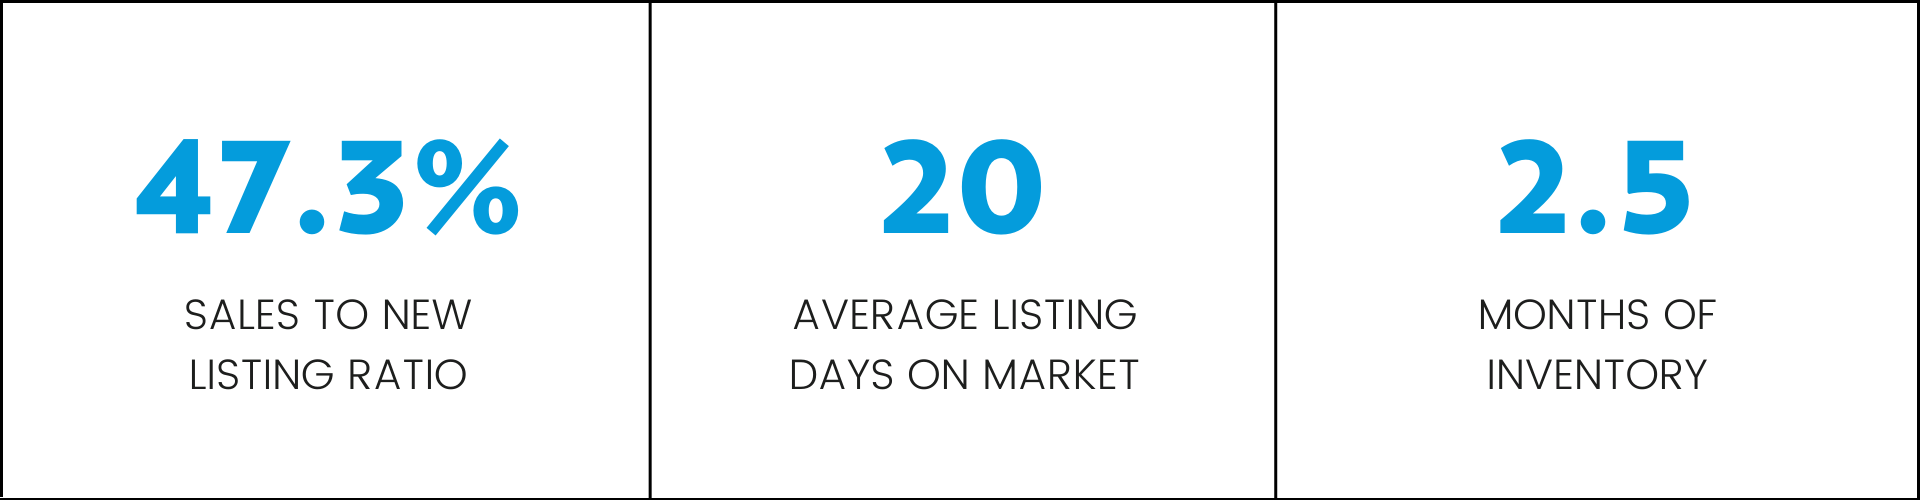
Understanding key real estate market metrics: sales to new listing ratio, days on market, and months of inventory:
The sales to new listing ratio tells us how many of the newly listed properties are being sold in a certain time frame. If the ratio is around 50%, it means the market is balanced. But if it goes above 60%, that's when we start to see a seller's market, where prices tend to rise. So, the higher the ratio, the better it is for sellers and the more competitive the market becomes for buyers.
The average days on market refers to the average amount of time that it takes for a property to be sold after it is listed for sale. This can be a useful metric for understanding how quickly homes are being snapped up in a particular area.
Lastly, the months of inventory ratio is a measure of the amount of time it would take for all of the currently listed properties to be sold, based on the current rate of sales. It's a useful metric for understanding how much supply there is relative to demand in a particular area. For example, if there are 100 properties currently listed for sale and 20 of them are sold each month, it would take 5 months to sell all of the properties (100 / 20 = 5).
September 2023:
September 2022:

The sales to new listing ratio (SNLR) has shown a significant shift over the past year, dropping another 2% since August. While we've firmly transitioned into a balanced market, the SNLR, hovering near 47%, is gradually edging downward, signalling a gradual shift towards a buyer's market.
In real-time, we've observed that buyers are becoming increasingly discerning, demonstrating a distinct preference for properties that meticulously fulfill their specific wants and needs. If the trend of increasing new listings coupled with low sales persists, we can expect to witness a steady rise in both the average days on the market and the months of inventory.
“The short and medium-term outlooks for the GTA housing market are very different. In the short term, the consensus view is that borrowing costs will remain elevated until mid-2024, after which they will start to trend lower. This suggests that we should start to see a marked uptick in demand for ownership housing in the second half of next year, as lower rates and record population growth spur an increase in buyers,” said TRREB President Paul Baron.
The Toronto real estate market is dealing with a complex set of challenges, including high borrowing costs, inflation, economic uncertainty, and slower growth. These factors are impacting the sales, prices, and listings in Toronto and the GTA.
Market experts are hopeful that lower interest rates and population growth will drive demand in the future. However, addressing affordability and aligning policies at all government levels is crucial to finding a more sustainable solution to the housing crisis.
If you have any questions or would like more information on recent home sales in your specific neighbourhood, don't hesitate to give me a shout at 416.856.1937 or Suzanne@suzannelewis.ca.